This topic describes how to access Domino’s dashboard which shows all models being monitored, both Model APIs and those deployed elsewhere.
To see all models, in the navigation pane, click Model Monitor.
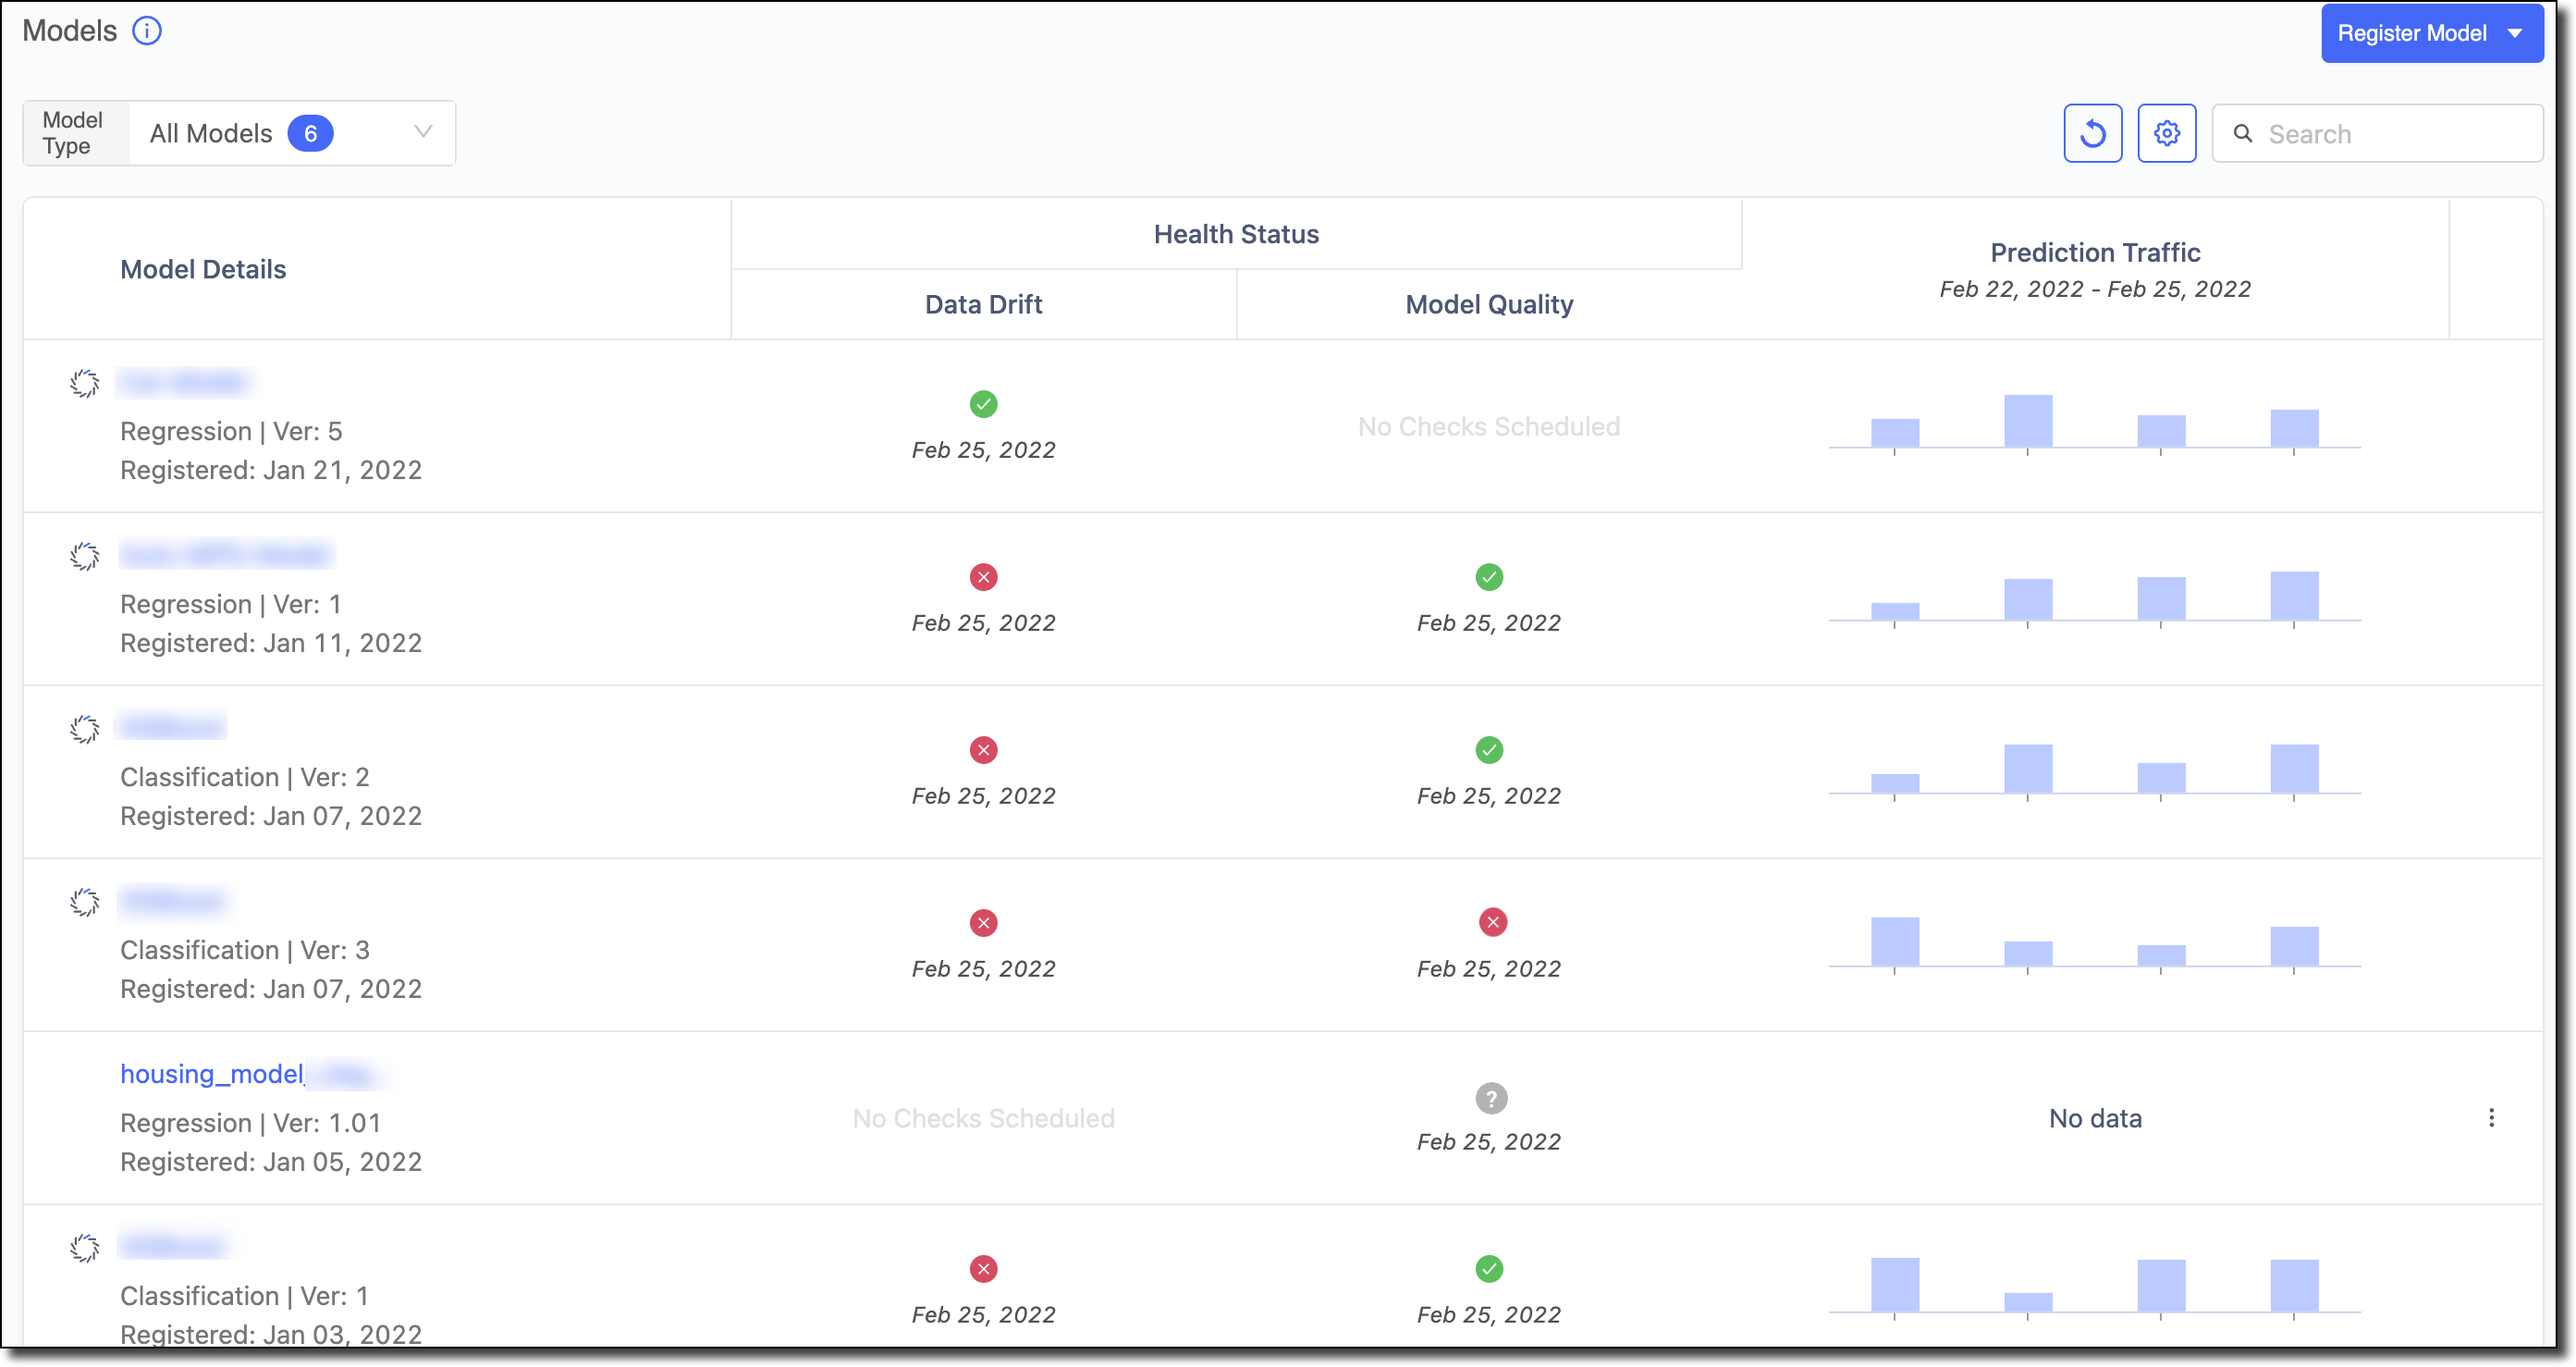
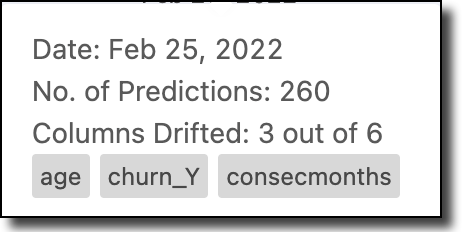
You can see a list of all models, their health status, and prediction traffic. If one or more features for the drift value or model quality for a model doesn’t meet the test criteria, the model status is marked in red to indicate the features have drifted beyond the threshold. You can hold your mouse over the red circle in the appropriate column to see more details about the issues:
You can set up notifications to alert on breached thresholds for drift or model quality.
-
In the navigation pane, click Model APIs.
-
Click the model whose dashboard you want to see.
-
Click Monitoring. The dashboard opens and shows the Data Drift and Model Quality charts, if both are enabled.