For this tutorial, we’ll use the Palmer Penguins data. We have already filtered out some records with missing data and selected a subset of columns.
-
Hover over the
 icon. Select the Transformations item from the popup menu.
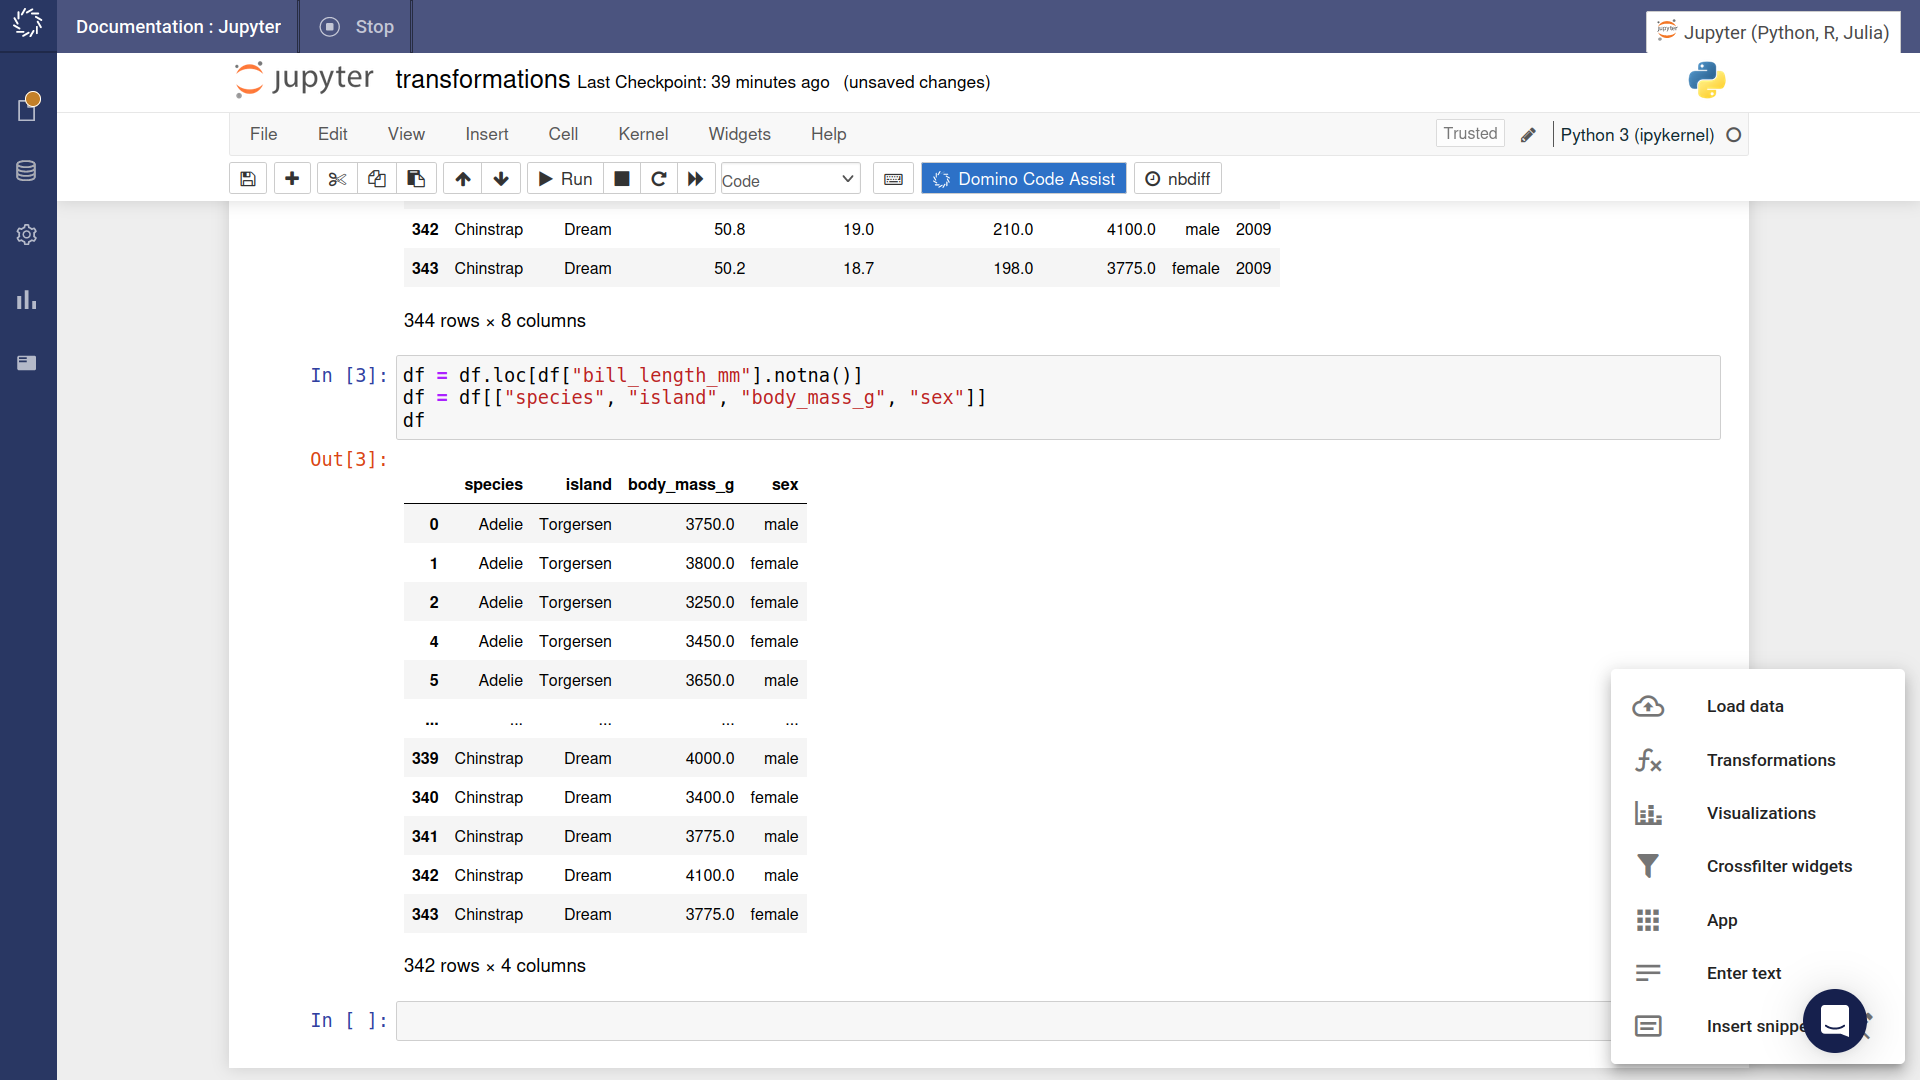
-
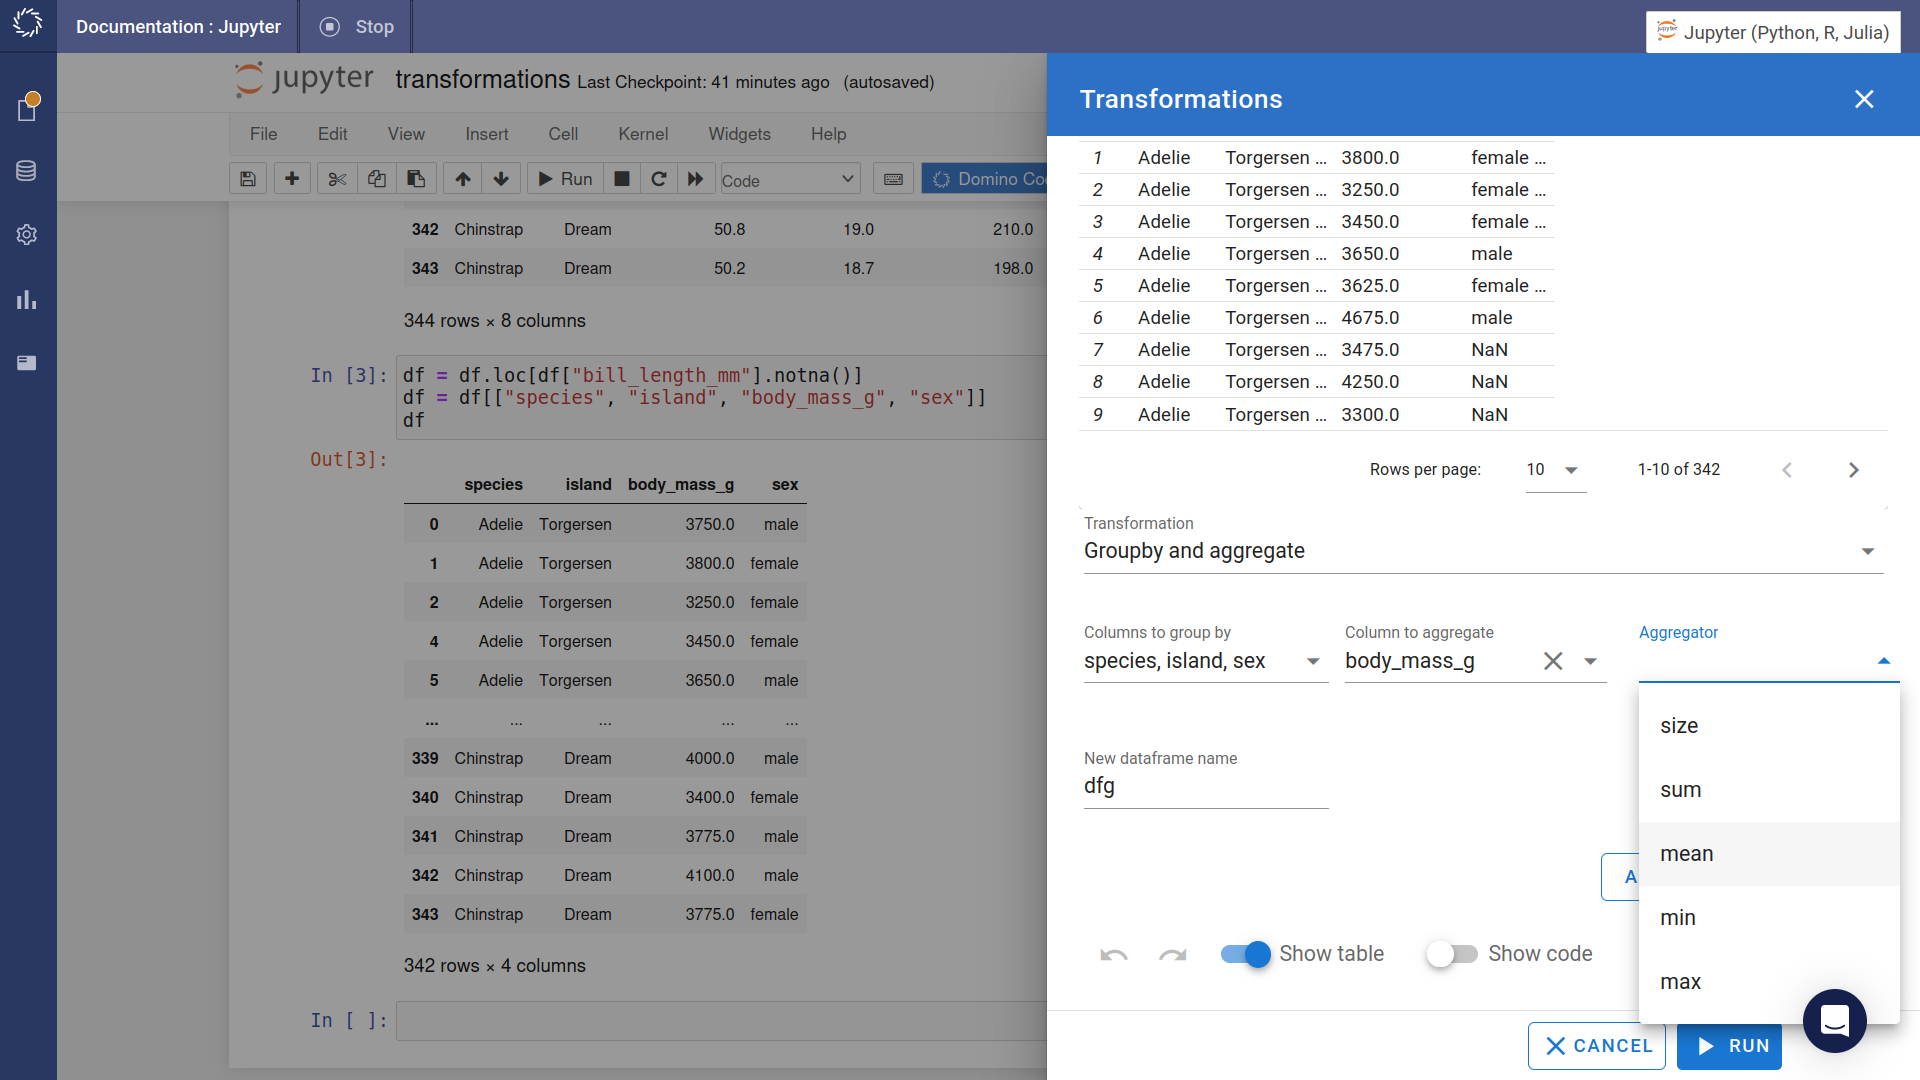
The transformations widget opens. Select the Groupby and aggregate transformation option.
-
Choose one or more columns to group by. These determine the buckets that the results are allocated to. Generally, you’ll want to select columns with discrete values.
-
Choose the column to aggregate. Generally, you’ll want to select a column with numeric values.
-
Select an aggregation function.
-
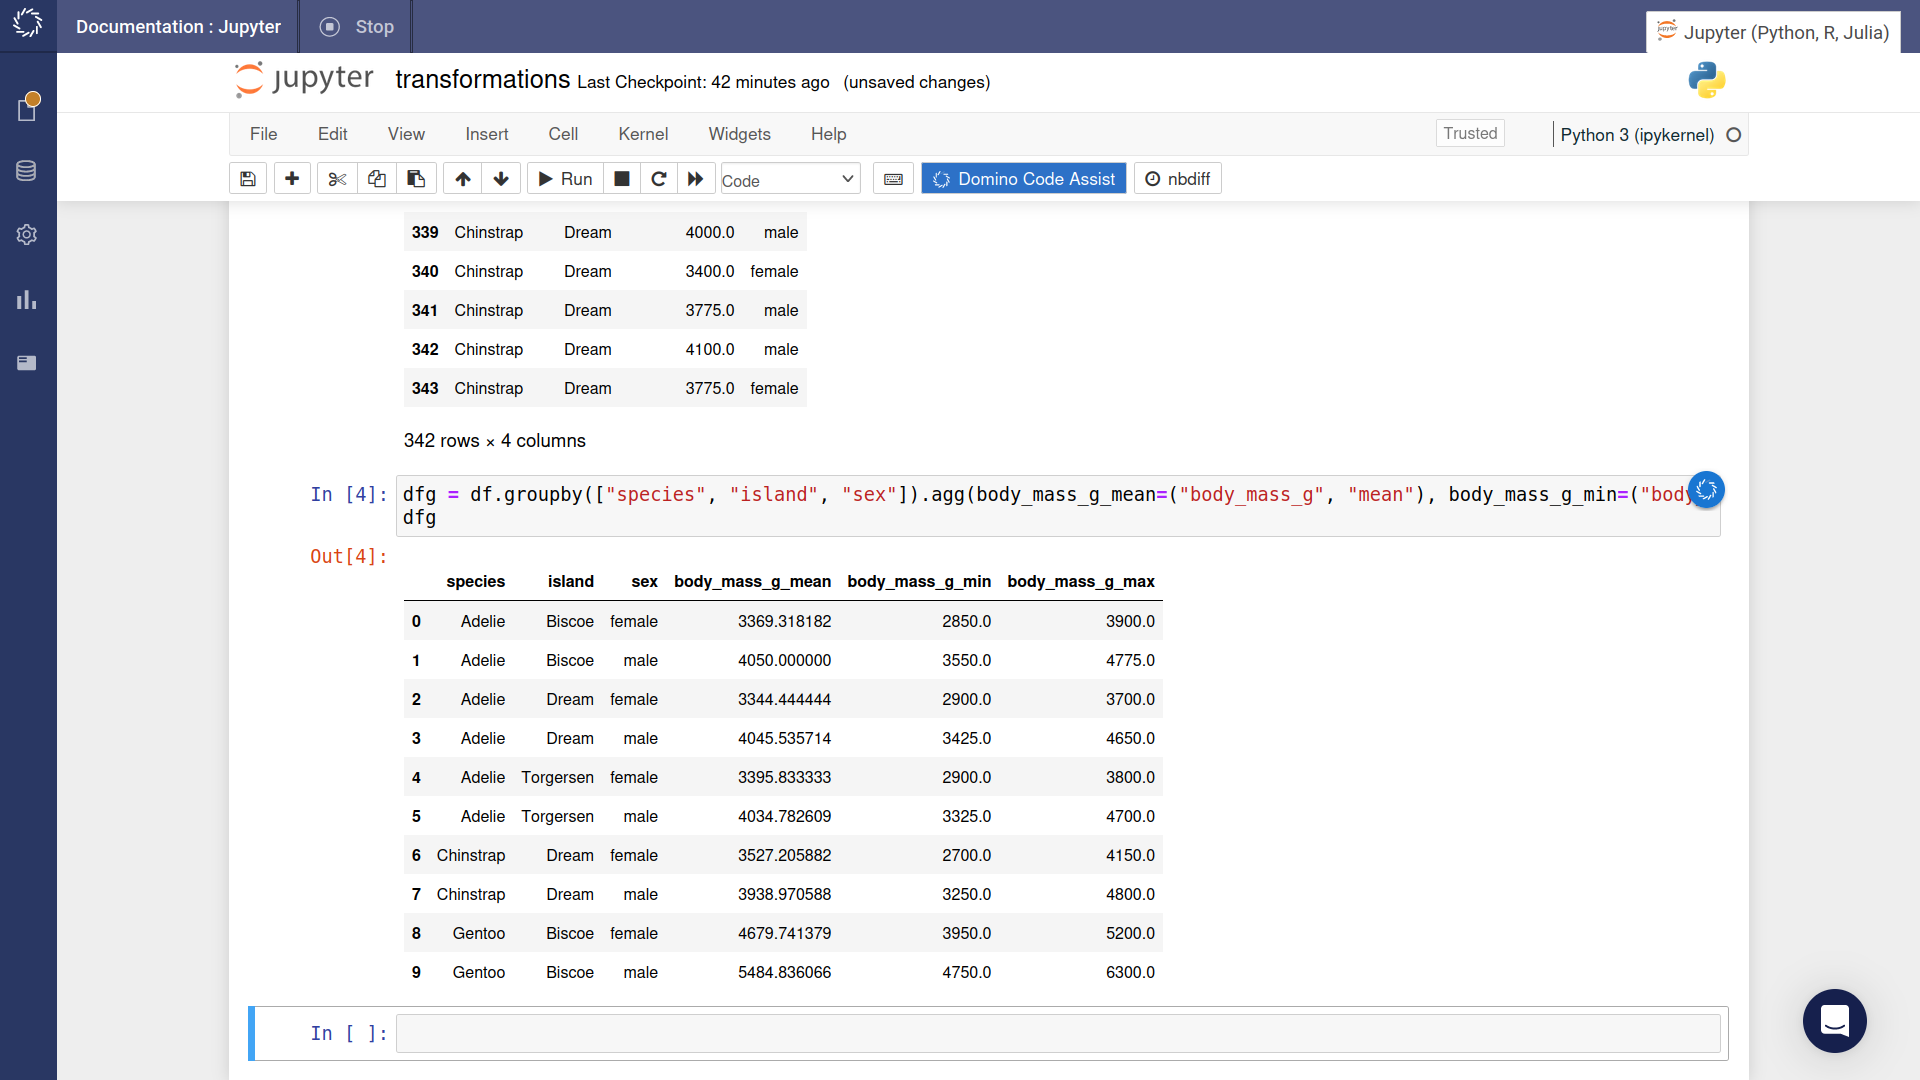
You can add more aggregations. It’s not necessary to choose the same column to aggregate.
-
Preview the results. Press the button.
-
The required code is inserted into the notebook and immediately executed.